- Published on
Observability in Practice
- Authors
- Name
- Lili Cosic
- @lilicosic


About me
Let’s start with a short introduction, as this is my first post on my personal blog post. My name is Lili Cosic and I am a software engineer. I was a Senior Software Engineer at HashiCorp, where I was part of a team that shipped the Cloud Boundary Service to general availability. I have been working in and around the cloud infra for the past six years, primarily on all things Kubernetes. At Red Hat I was involved on OpenShift monitoring, etcd, and upstream monitoring projects like prometheus-operator and kube-state-metrics. Recently in the cloud boundary team, I have been using the observability knowledge I gained from many years on the monitoring team and applying it in practice, this post is some of the things I learned from that journey.
Purpose of Observability
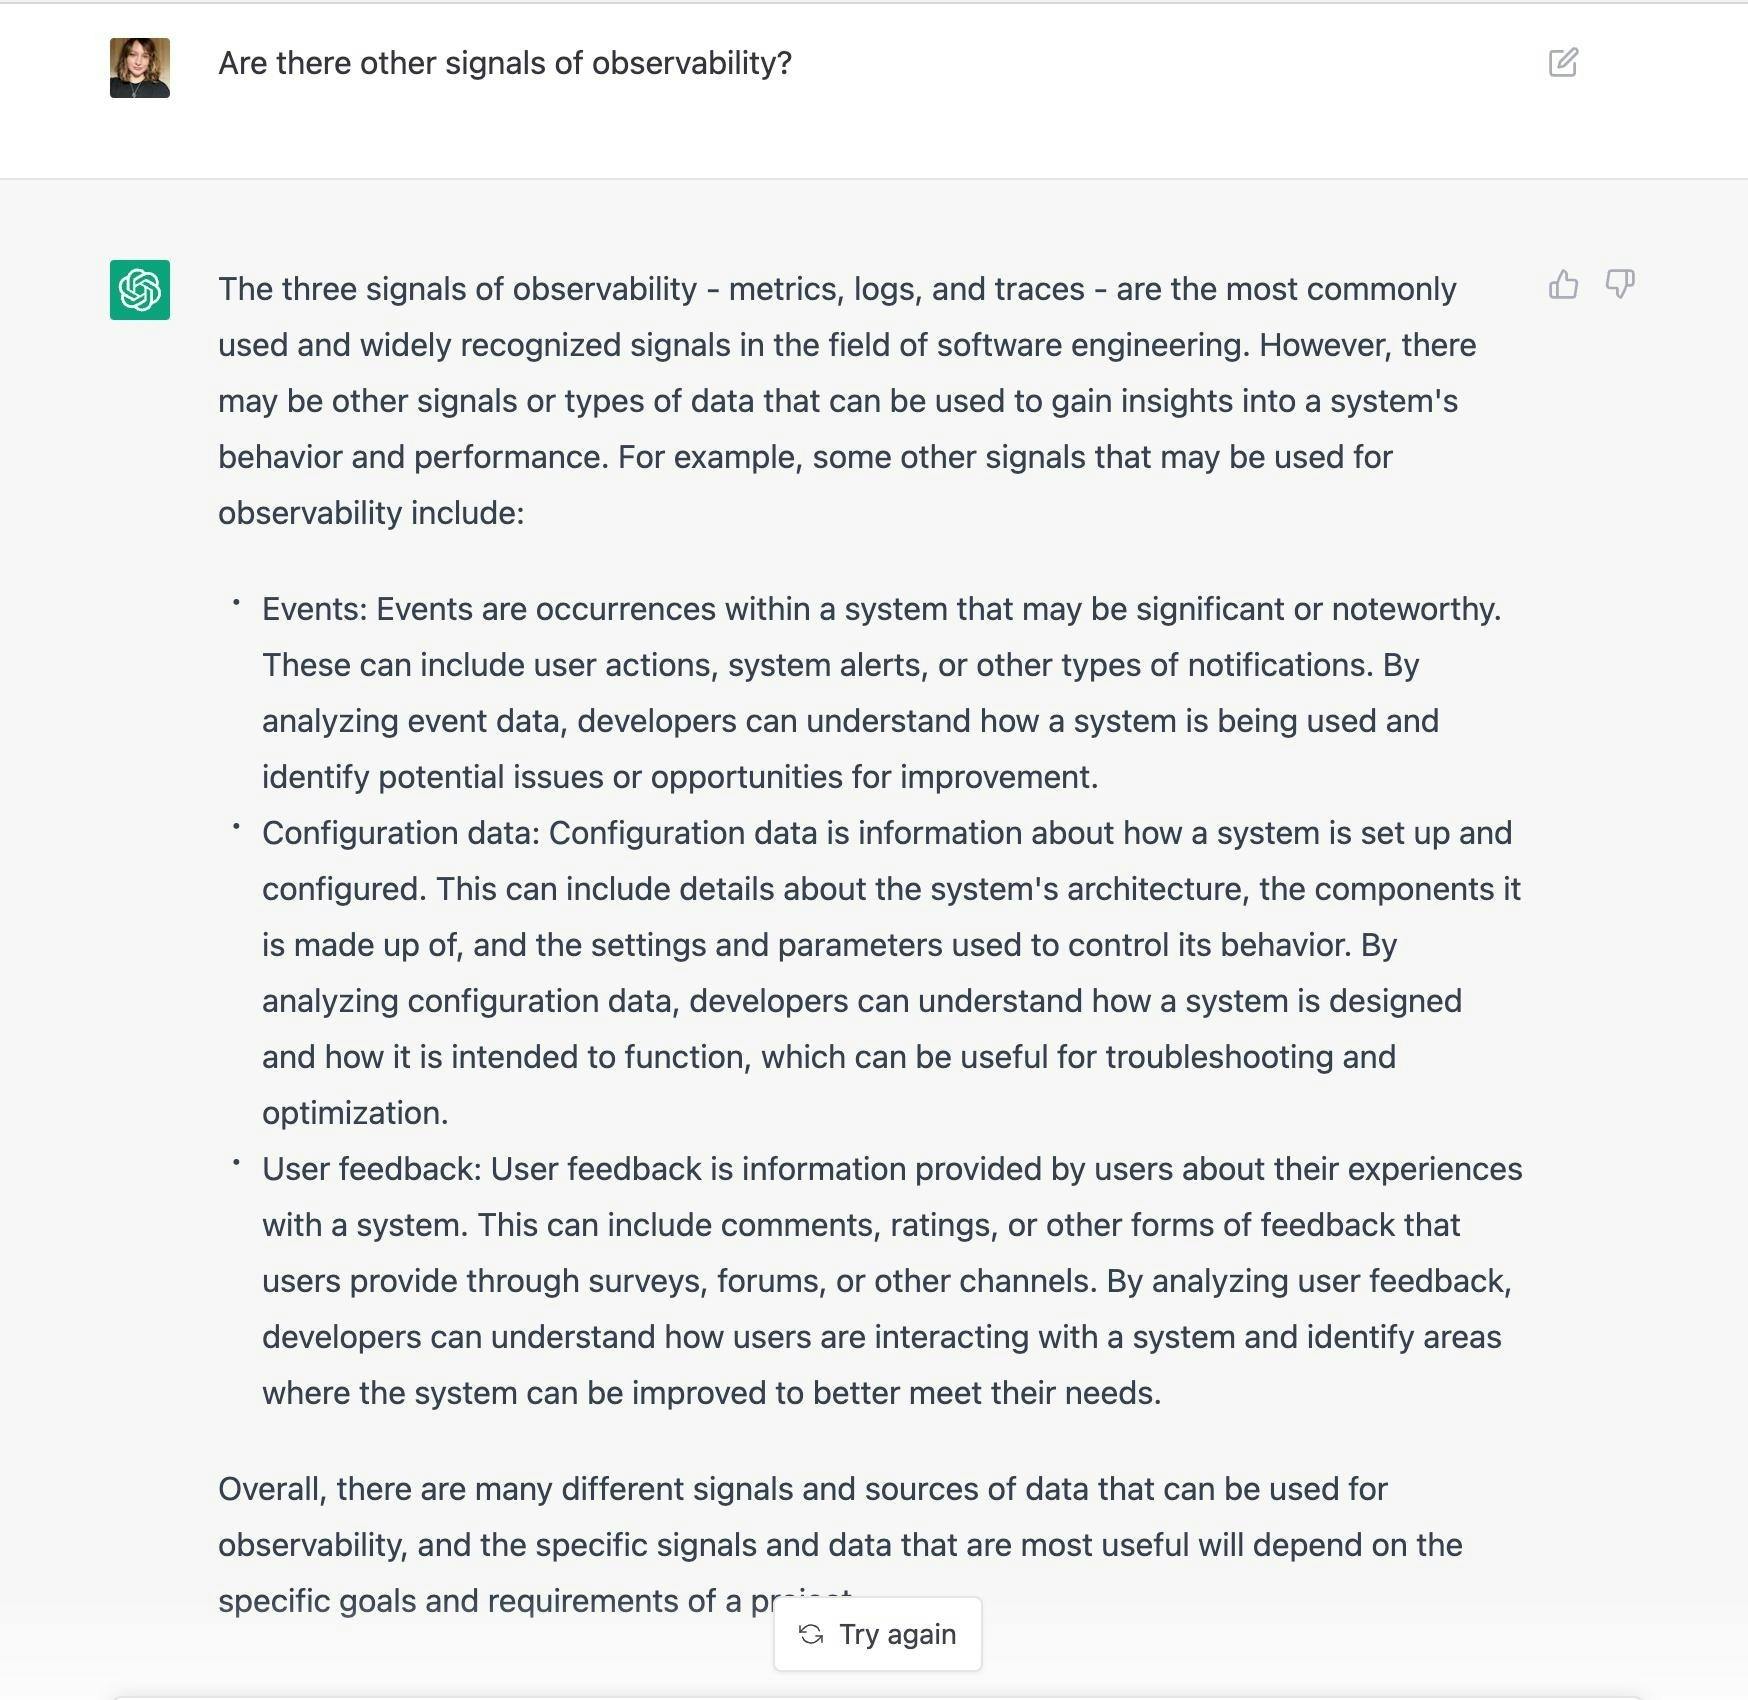
What is observability? Observability means many different things to different people. Some people claim monitoring should be used as the correct term and that observability is just marketing. In the past few years, we came to understand the term observability as the grouping of metrics, logging, tracing, profiling, etc.
Observability for the purpose of this post means a collection of signals and tools that help you develop, observe and troubleshoot your application in production and other environments. A signal is any observability tool you can use to achieve that.

How to do Observability in the Real World
In an ideal world where financial budget, people resources, scalability, and deadlines don’t exist, the perfect observability stack differs significantly from what I will describe. My ideal stack would be either running all open source projects myself, but that would require a large team to be on call for this. Or if I were to compromise I would run the monitoring system myself and pay for other services I am not too familiar with as hosted solutions. I would run something like Prometheus, Alertmanager with Thanos and various exporters (like kube-state-metrics, DB exporters, etc.). Essentially if using Kubernetes then deploying kube-prometheus (not the helm chart as that is not official!). That would give me the equivalent to what most monitoring solutions out there offer. Most of the time, whether an early-stage startup or enterprise, you will work with some legacy or preferences within the company or simply choose a shortcut due to lack of time and that is okay!
It can be overwhelming to start adding observability with many signals if you are building a new application or trying to add all observability signals to legacy code. But the first thing to understand is that no one has an ideal observability stack! Start using only the ones you found helpful while developing, and eventually, you will get to your perfect stack tailored towards your specific needs.
Define Your SLO
Ideally, the product owner would define the SLA - service level agreement - together with the engineers so you can identify your SLIs - service level indicators - this can be for example, error rate or latency. Then it's up to the engineers to set the SLO, set up budgets and buffers, and finally alert on those before you breach the agreement.
Note that in real life, not every API and feature will be covered by the SLA, but you should still define alerts for those APIs or features. Even if you are not breaching the SLA, it doesn’t mean you should stop caring if those work, so add SLO alerts for those non-critical features! But remember to add warning-level, non-pageable alerts. SLA should, in an ideal world, include a latency indicator, but that isn't often the case in practice. But teams still page on latency alerts even if it doesn’t go against their budget, as it doesn’t provide a good user experience.
But often, on-call pages are expensive both in time spent and on-call compensation, so knowing what to page on is essential. Sure, in an ideal world, we would want to care about ALL the bugs and all the requests, as well as annoying latency, but in practice, this does not work, so working closely with your product manager to see what they care strongly about might surprise you and save you a sleepless night. Besides the cost aspect, too many SLO can cause alert fatigue.
Symptoms of Alert Fatigue
Alert fatigue is when you get too many false positive alerts, and in turn, you can no longer trust your alerting and monitoring system. If you have ever experienced it, then you know the name “fatigue” is an understatement, and it should really be called alert burnout. So what are the main symptoms of alert fatigue, and how can you combat it?

Symptoms of alert fatigue:
- Not trusting your alerts
- Ignoring alerts as it's just a flake
- Developing an instinct of “ah yes, that must be that flake, and this is fine.”
- "Ah yeah that alert, it's actually fixed"
- Sudden urge to silence every alert that fires
Paging only on things related to your service level agreement means you are only on alert for every single error, this helps prevent alert burnout. You can create tickets for warning alerts that fire and prioritise issues later. Alerts as a way to discover bugs; the priority of those bugs can vary depending on their user impact.
Metrics and Monitoring
Metrics is what I think of when I hear the word monitoring, and it is the signal I default to most of the time for troubleshooting and understanding. It’s my favourite signal, as I have worked in the monitoring field for many years. If you can afford it, try to expose as many metrics as possible, but the high cost of cardinality means you might need to change retention for specific metrics or applications and, that way, cut the cost. If you don’t know where to start with metrics, exposing basic gRPC or REST API error and latency metrics is a good start. Then use those metrics to create the SLO as mentioned earlier alerts, and you are halfway to observability.
Dashboards are Overrated
Same as alerts, creating too many dashboards that no one uses but you is not practical. Saving individual queries for metrics, profiles, and logs is more intentional and less distracting when troubleshooting an incident. Dashboards can lead you down the wrong path, and I have in the past come to the wrong conclusion and wasted a lot of time as I was distracted by a random spike on a predefined dashboard. I am not saying dashboards are never helpful, but for me, bookmarked queries and great runbooks lead to better and quicker recoveries with less downtime. But if you are used to dashboards, saving queries and creating a dashboard on need by need basis, for example, when there is an incident, troubleshooting or reporting saves you time.
Logging Should Die
Yes, it’s a harsh statement that logging should die, but it is the thing most people start with, so it's no wonder it's the signal everyone has invested the most into, yet logging is free form at the same time. And yes, to be honest, I do use logs more than I would like to admit for troubleshooting. Yet as a signal, it’s hard to search through and hard to understand, and while a lot of languages have standards, I have often seen, even within one team, people doing 100 different ways of logging errors. Also, trying to read tail logs from a noisy container is a skill I shouldn't need to have.


Run, Run, Runbooks
Investing in good and clear runbooks is a time saver. Don't be ashamed of actually using those runbooks each time, this essentially tests them and ensures they are up to date. Also having those linked from alerts is a good practice. Define a template on what a runbook should include as a bare minimum and try to include as many commands that you can copy and paste in the middle of the night if needed.
Standardised Signals
The idea of standardising within a young observability industry is excellent, and it helps both the users and companies use a common protocol. Open Telemetry is a collection of tools, APIs, and SDKs according to the project page. Use it to instrument, generate, collect, and export telemetry data (metrics, logs, and traces) to help you analyze your software’s performance and behavior. But trying to standardise takes a long time, and it can often mean that users just go with what already exists. Tracing is the one signal that is well-defined and available in open-telemetry and featureful, and the others are not yet fleshed out and sadly APIs do break which can be tiring for end users, so there is for sure still work to be done in that area. But I am looking forward when it's more stabilised. I do wish more end-user companies would invest into this project, that understand their needs the best.
Understandability - Observability Beyond Troubleshooting
The new signals of observability, like tracing and continuous profiling, or as it's sometimes called - understandability. Observability helps you observe but in some cases you also need to understand what your service is doing and how it's doing this. Tracing and continuous profiling help you get to the bottom of slow requests and OOMs, and most of us have experienced those or will in the future. So consider using those new signals over logging, especially when you are out of ideas. It’s worth learning new tools and sharpen your toolkit and that includes observability signals.
Profile, profile, profile
Profiling has been well known and used for a long time, and Google has been doing continuous profiling within the company for years now. But in recent years, the concept of continuous profiling has started to emerge as a new signal of observability in various open source projects. Personally I like Parca as it offers profiling with zero need to change your codebase, but I am biased as its created by the people I trust, and I know they put their heart and soul into it! Anyways, profiling lets you have an insight into your application down to the line number of your code. That makes it very powerful, and when you run it in continuous manner in your cluster on all the time it allows you to just look up past data, which is useful for improving performance of running applications, saving cost or those annoying OOMs.


Tracing - It's On Everyone's Backlog
Tracing gives you an insight into what happens when the user or an application makes a request (typical case). If you use tracing actively in your company, I salute you, and you deserve the observability boss-level badge! The initial buy-in into tracing is a massive one, as you need to add and control all parts of your stack actually to make the traces useful, and that is not easy for everyone. This is why tracing tends to be lower on the priority list, and it takes a long time to implement, so it’s okay if you haven’t gotten around to instrumenting your entire codebase just yet.
But a good, more straightforward start is to instrument the high-level HTTP or gRPC service and add more detailed spans wherever you need them. Then the overhead of adding tracing is lower.
What have we observed in this post?
TL;DR:
- Instrument all the things, but only retain the important data points as we are not made of money.
- SLOs FTW! Set and SLA and define the SLO alerts and only page on SLO breaches.
- Document your most-used metrics, tracing, and profiling queries during the dev process into runbooks.
- Leave logging for last, this helps you sharpen the other signals.
- Focus on understandability signals early on, enable continuous profiling for your projects early on.
- Don’t forget to add tracing to your backlog and actually do it.
Disclaimer
Opinions expressed are solely my own and do not express the views or opinions of my employer. While I am also an advisor to Polar Signals, all opinions here are mine and mine alone, and not that of my company or Polar Signals.
End is in sight
Thank you for reading! If you enjoyed this or felt something was missing, you can reach out at https://hachyderm.io/@lili or https://twitter.com/LiliCosic. Also, let me know if you are interested in a follow-up post on how to add observability while developing a feature. I thought of doing a mock feature and walking through examples for each signal. Or if you have other blog post ideas ping me, as my 2022 2023 resolution is to write more!
If you need a collection of observability projects and tools, I try keep them in this live list on GitHub https://github.com/stars/lilic/lists/observability.
And thank you to those who reviewed this!